The Archipelago platform
Building trust through transparent data
The Archipelago platform’s core interfaces — property data grid, analytics dashboard, and transparency system — designed to transform industry-wide Excel chaos into trusted, systematic workflows
The challenge
Commercial real estate insurance has had a decades-old problem built on broken workflows that breed mistrust. The entire industry operated on a fragile system of Excel spreadsheets passed through multiple hands, accumulating errors and assumptions at every step.
The broken workflow: Risk managers would frantically collect data from property managers in urgent, year-end pushes, often resulting in typos (accidental extra zeros were alarmingly common) and coordination failures. These inconsistent Excel files would pass through brokers who reformatted them, then to insurers who, faced with suspicious or blank data points, would assume the worst possible values.
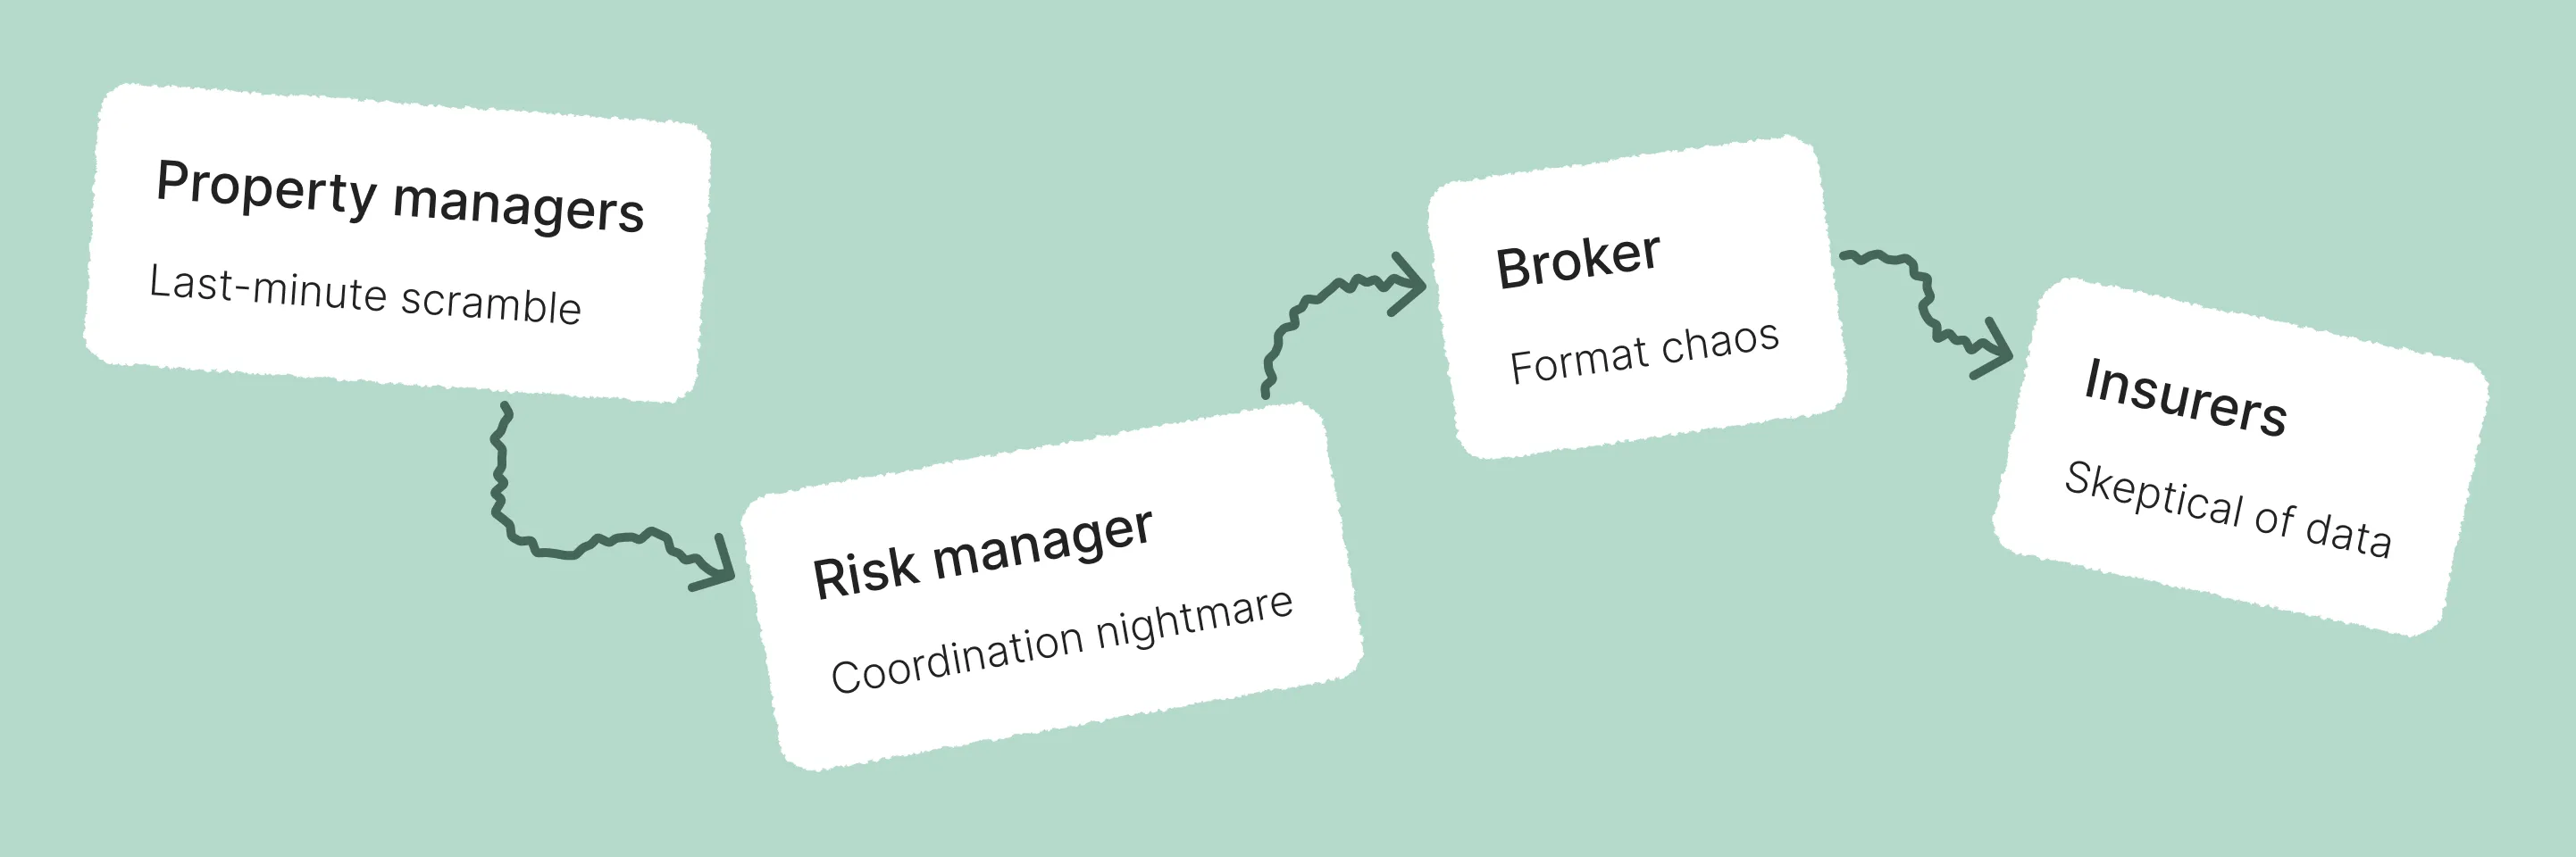
The broken workflow: Excel spreadsheets passed through multiple hands, accumulating errors and breeding mistrust at every step
The design challenge: How do you design an entire industry’s data workflow for trust & understandability? How do you continuously improve the data quality while lowering the workload?
Design process
With no existing platform solutions in the market, I began by deeply understanding the problem space through executive stakeholder workshops with customer Chief Risk Officers, field research including site visits across multiple customer companies, and workflow mapping to understand existing Excel-based submission processes. I needed to balance executive-level clarity with the detailed data needs of technical users, while working across engineering teams with very different capabilities.
Working within significant constraints became creative drivers that shaped innovative solutions. To work within limited end-user access, I positioned research as ‘early access pilot programs’ and joined customer success meetings. And those same users’ tech setups drove innovative approaches to data loading and grid performance optimization — one user told me they waited for colleagues to leave at 5pm so they could get more internet bandwidth.
The solution
I designed several key interface concepts that transformed how the insurance industry approached building data:
Multi-Level Data Grid: An interactive property grid allows users to scan thousands of buildings at once, while maintaining quick access to detailed information. The grid offers both high-level scannability & drill-down capabilities, including performance optimizations for users with limited internet bandwidth or lower-power hardware.
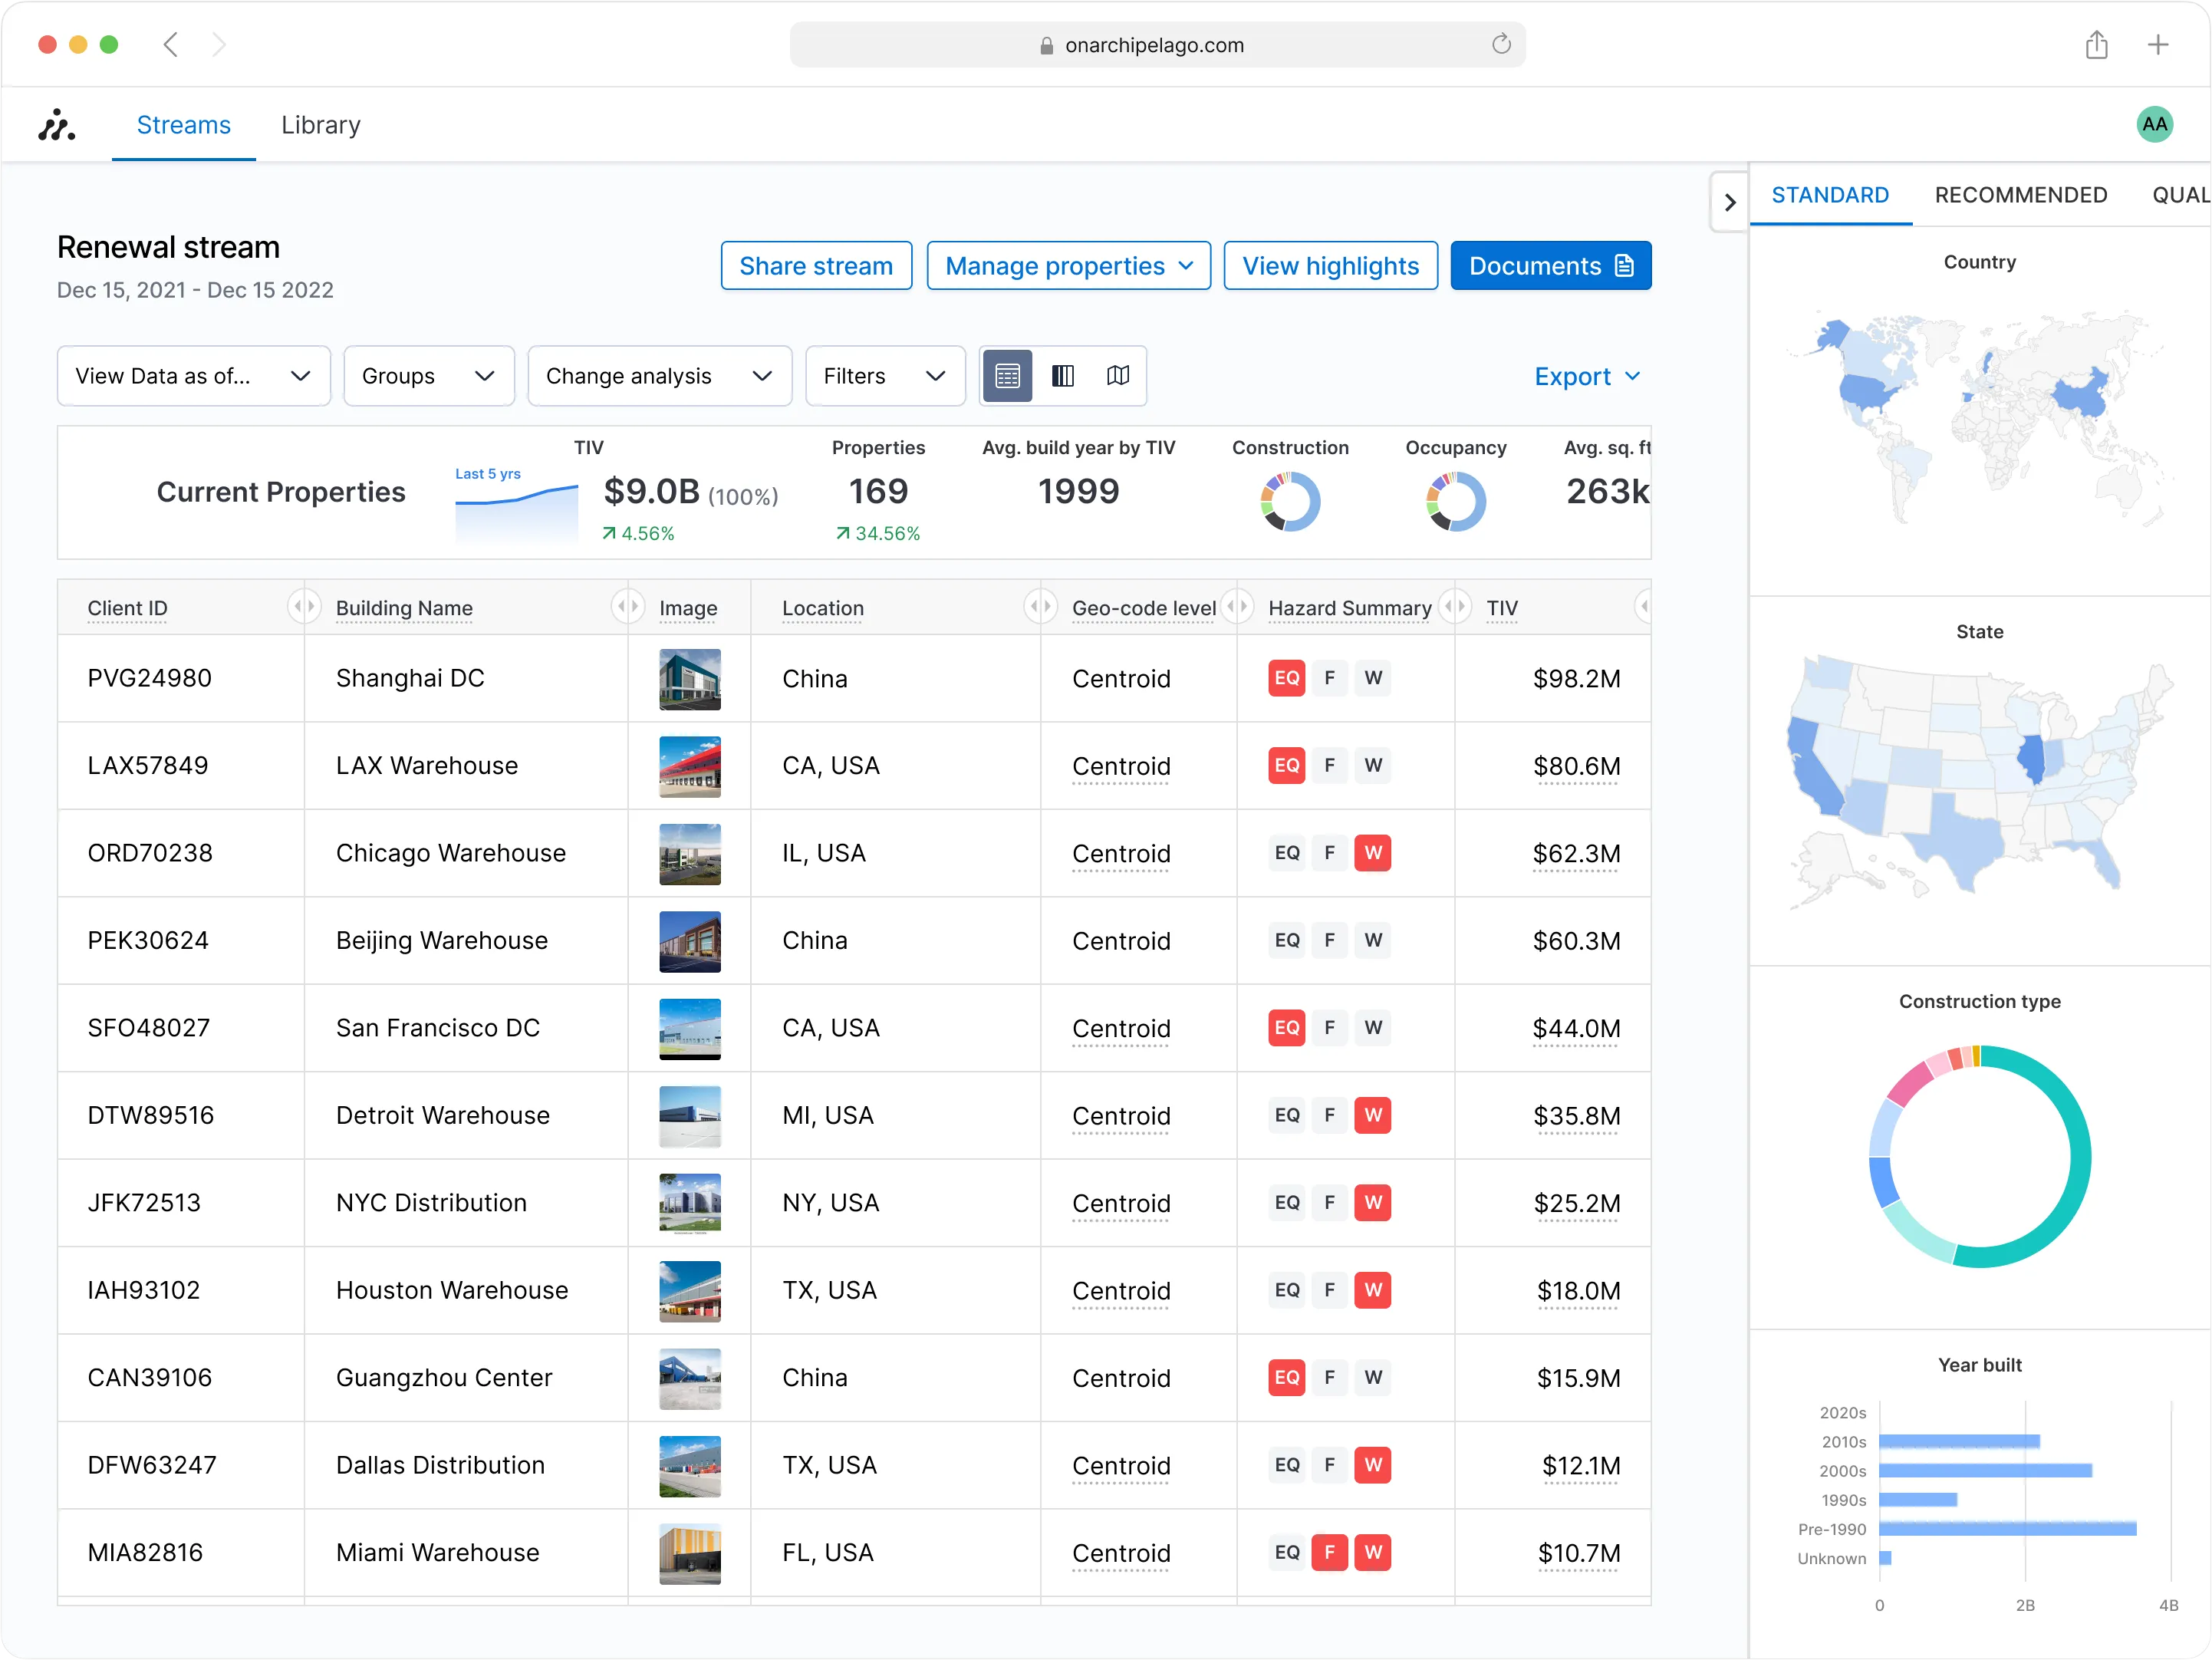
Multi-level data grid enabling users to scan thousands of buildings at once while maintaining quick access to detailed information
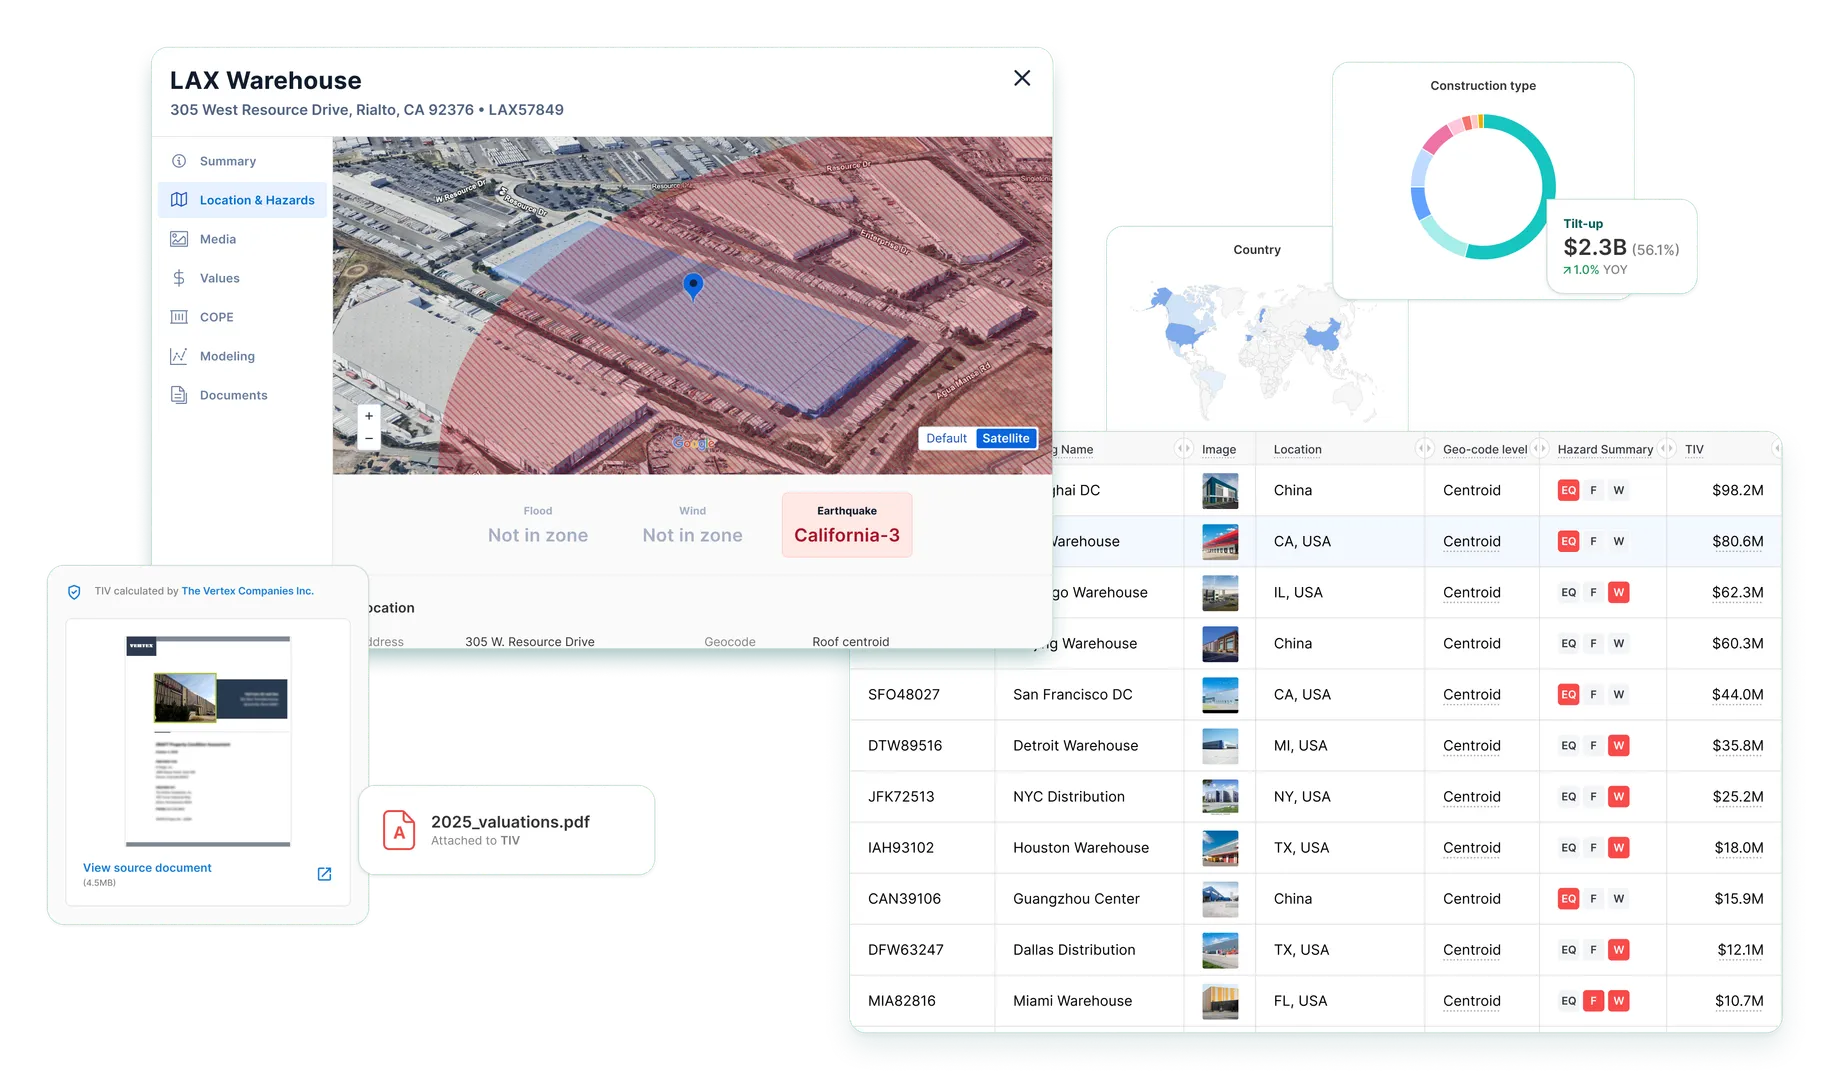
Integrated Geographic Context: Embedded Google Maps, with satellite imagery and 3D building models directly within property details, provides spatial context that helps users understand location-based risks and property relationships.
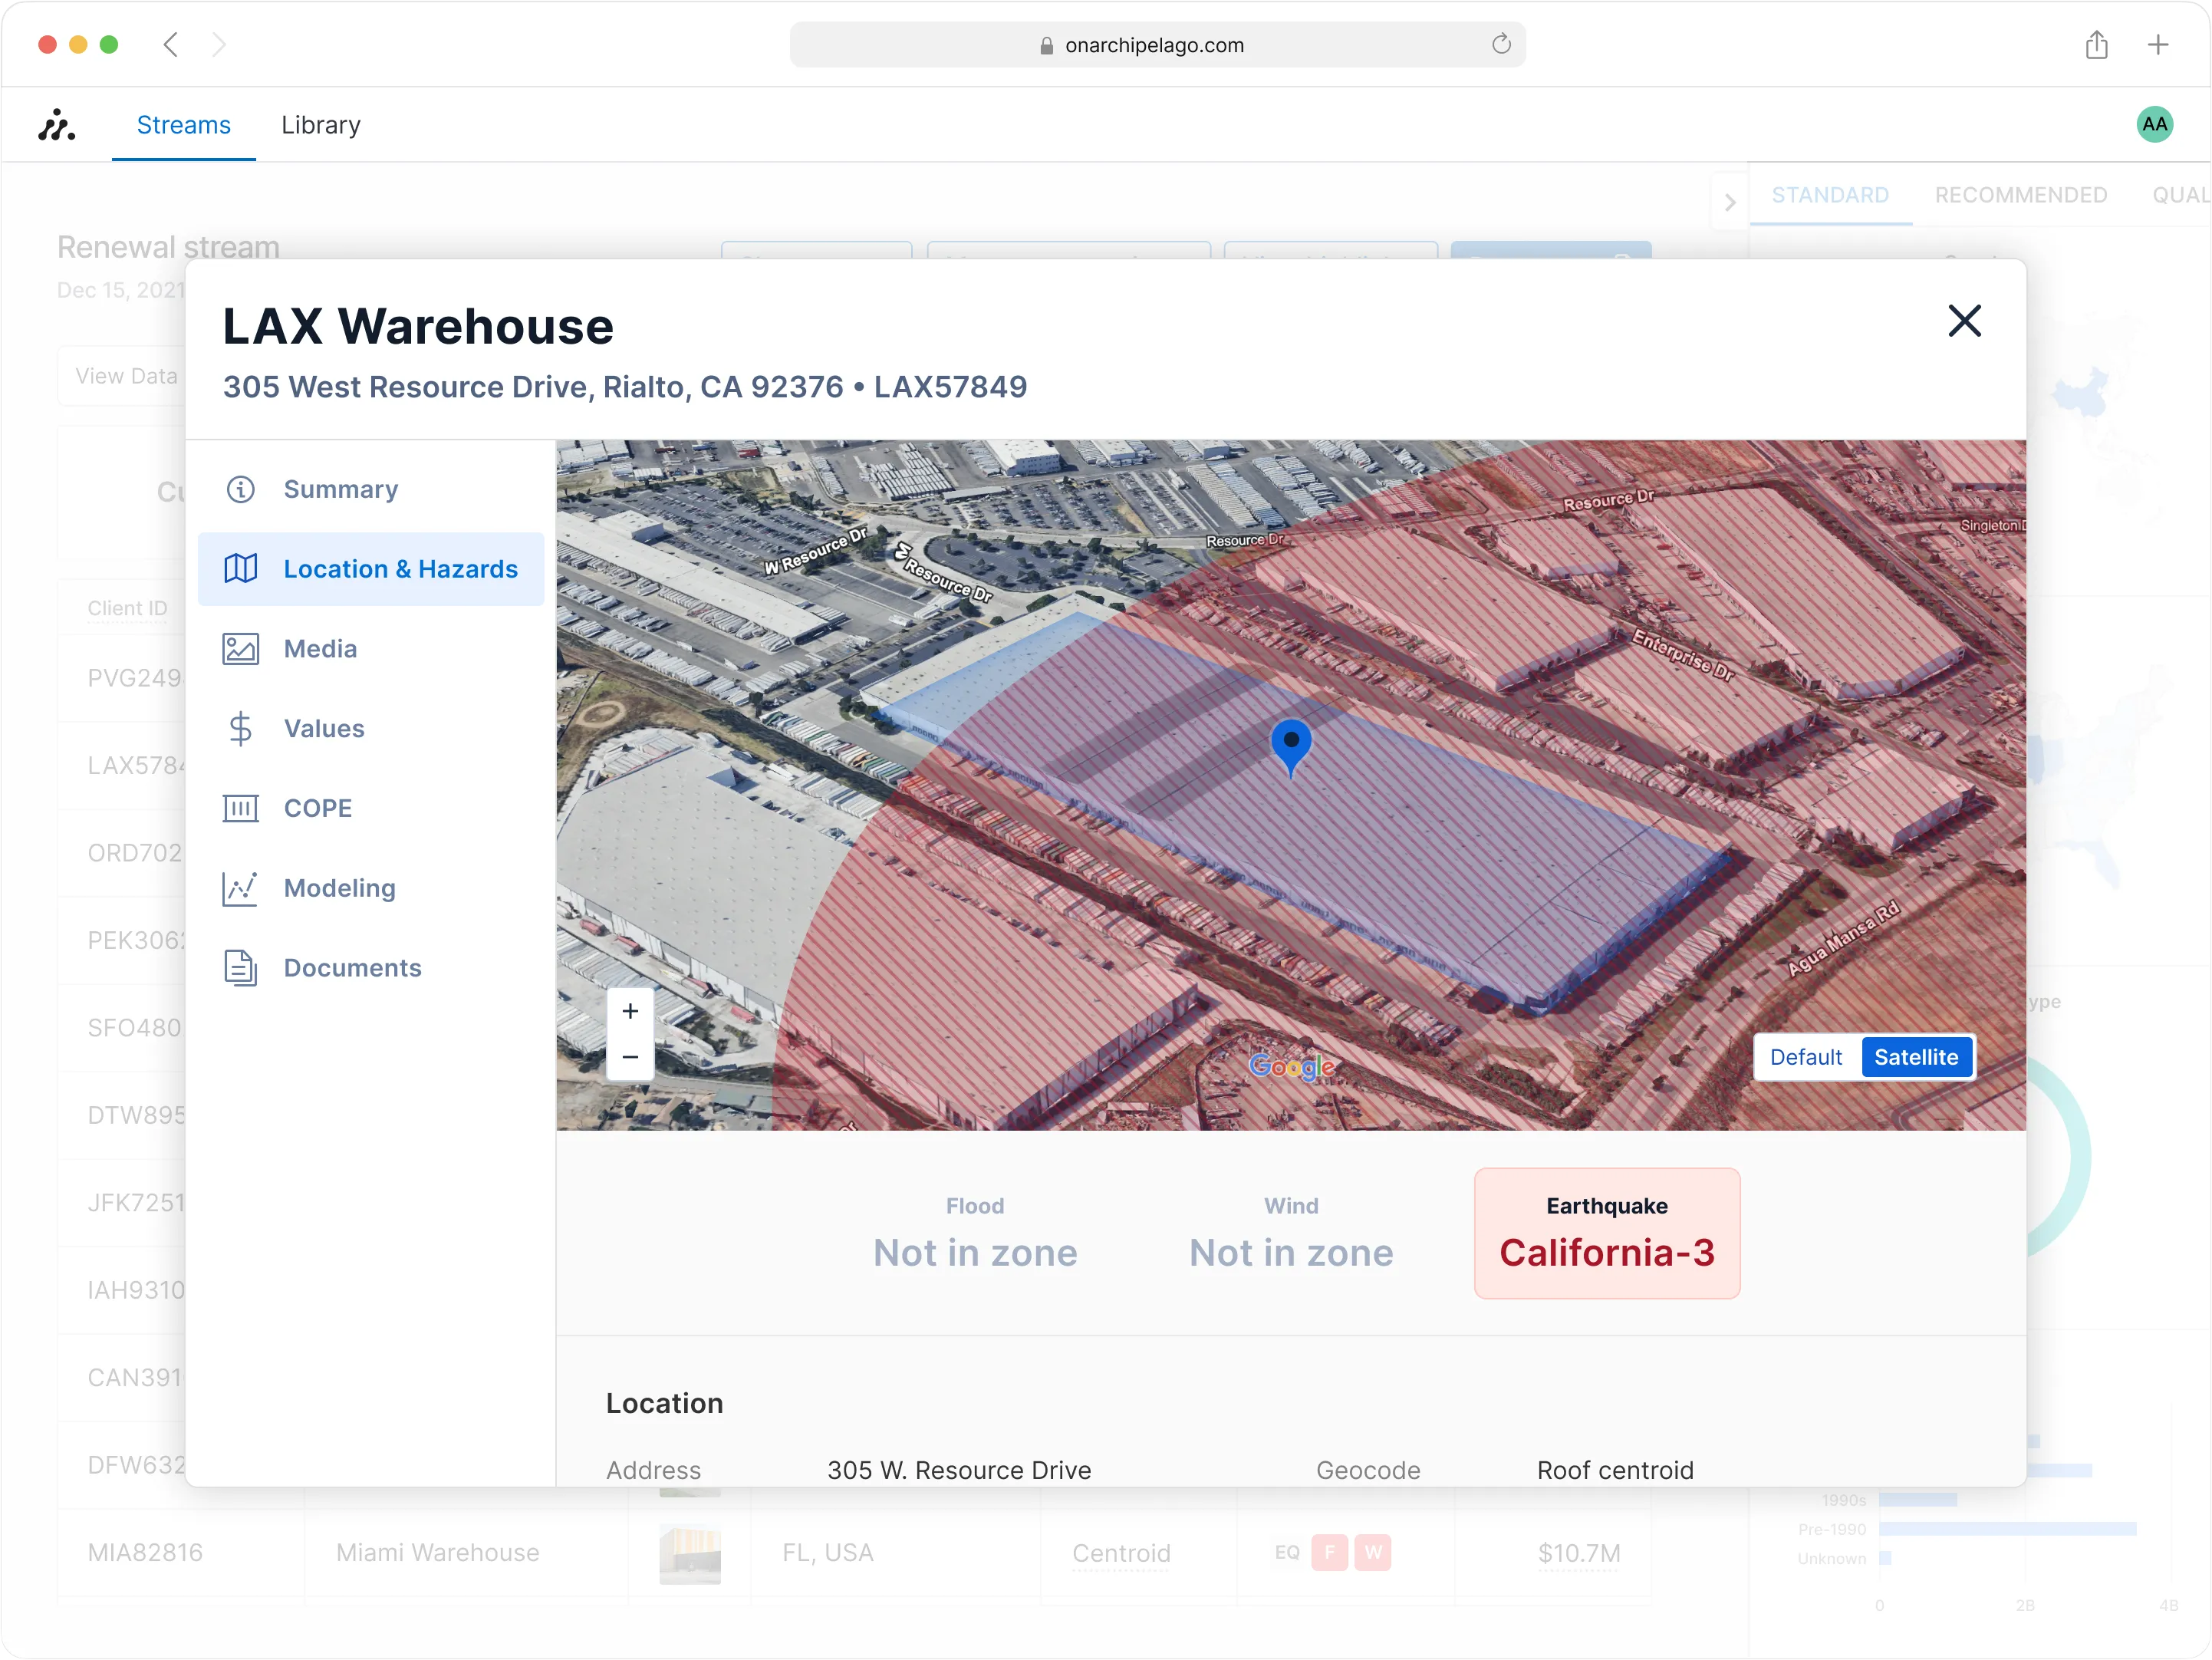
Geographic context integration: satellite imagery and 3D building models provide spatial understanding of location-based risks
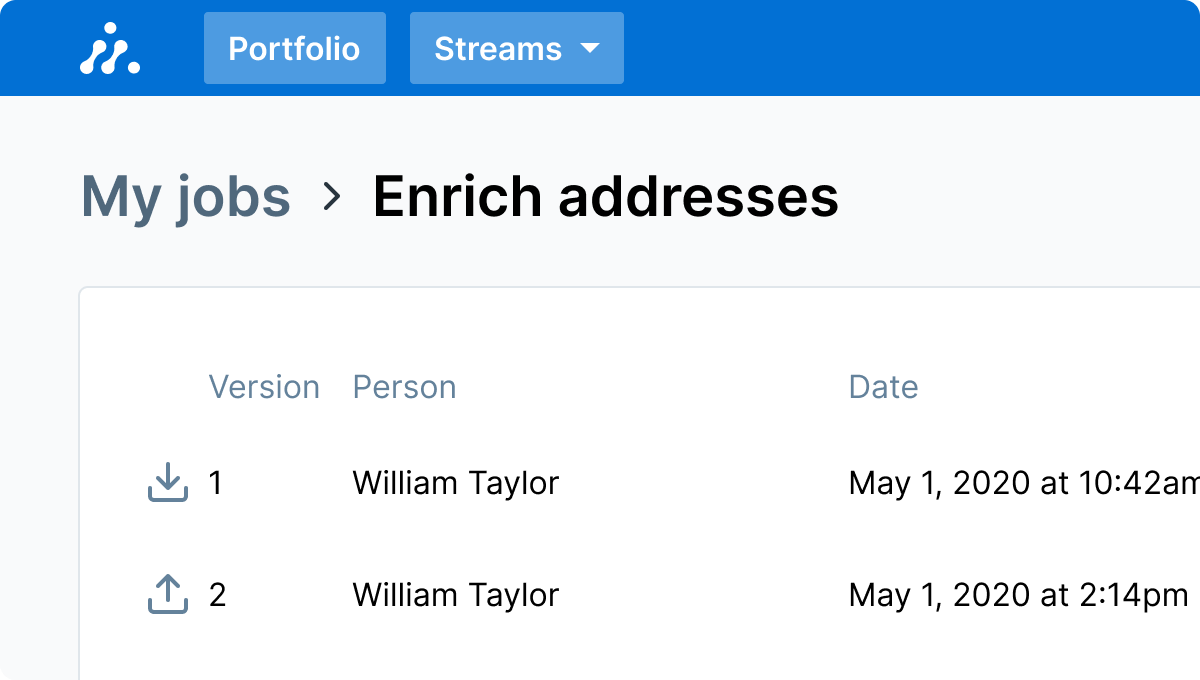
Trust-Through-Transparency System: Hovering over a data point reveals evidentiary documents, making the chain of custody visible. Rather than hiding complexity, the interface makes data sources and validation status immediately accessible.
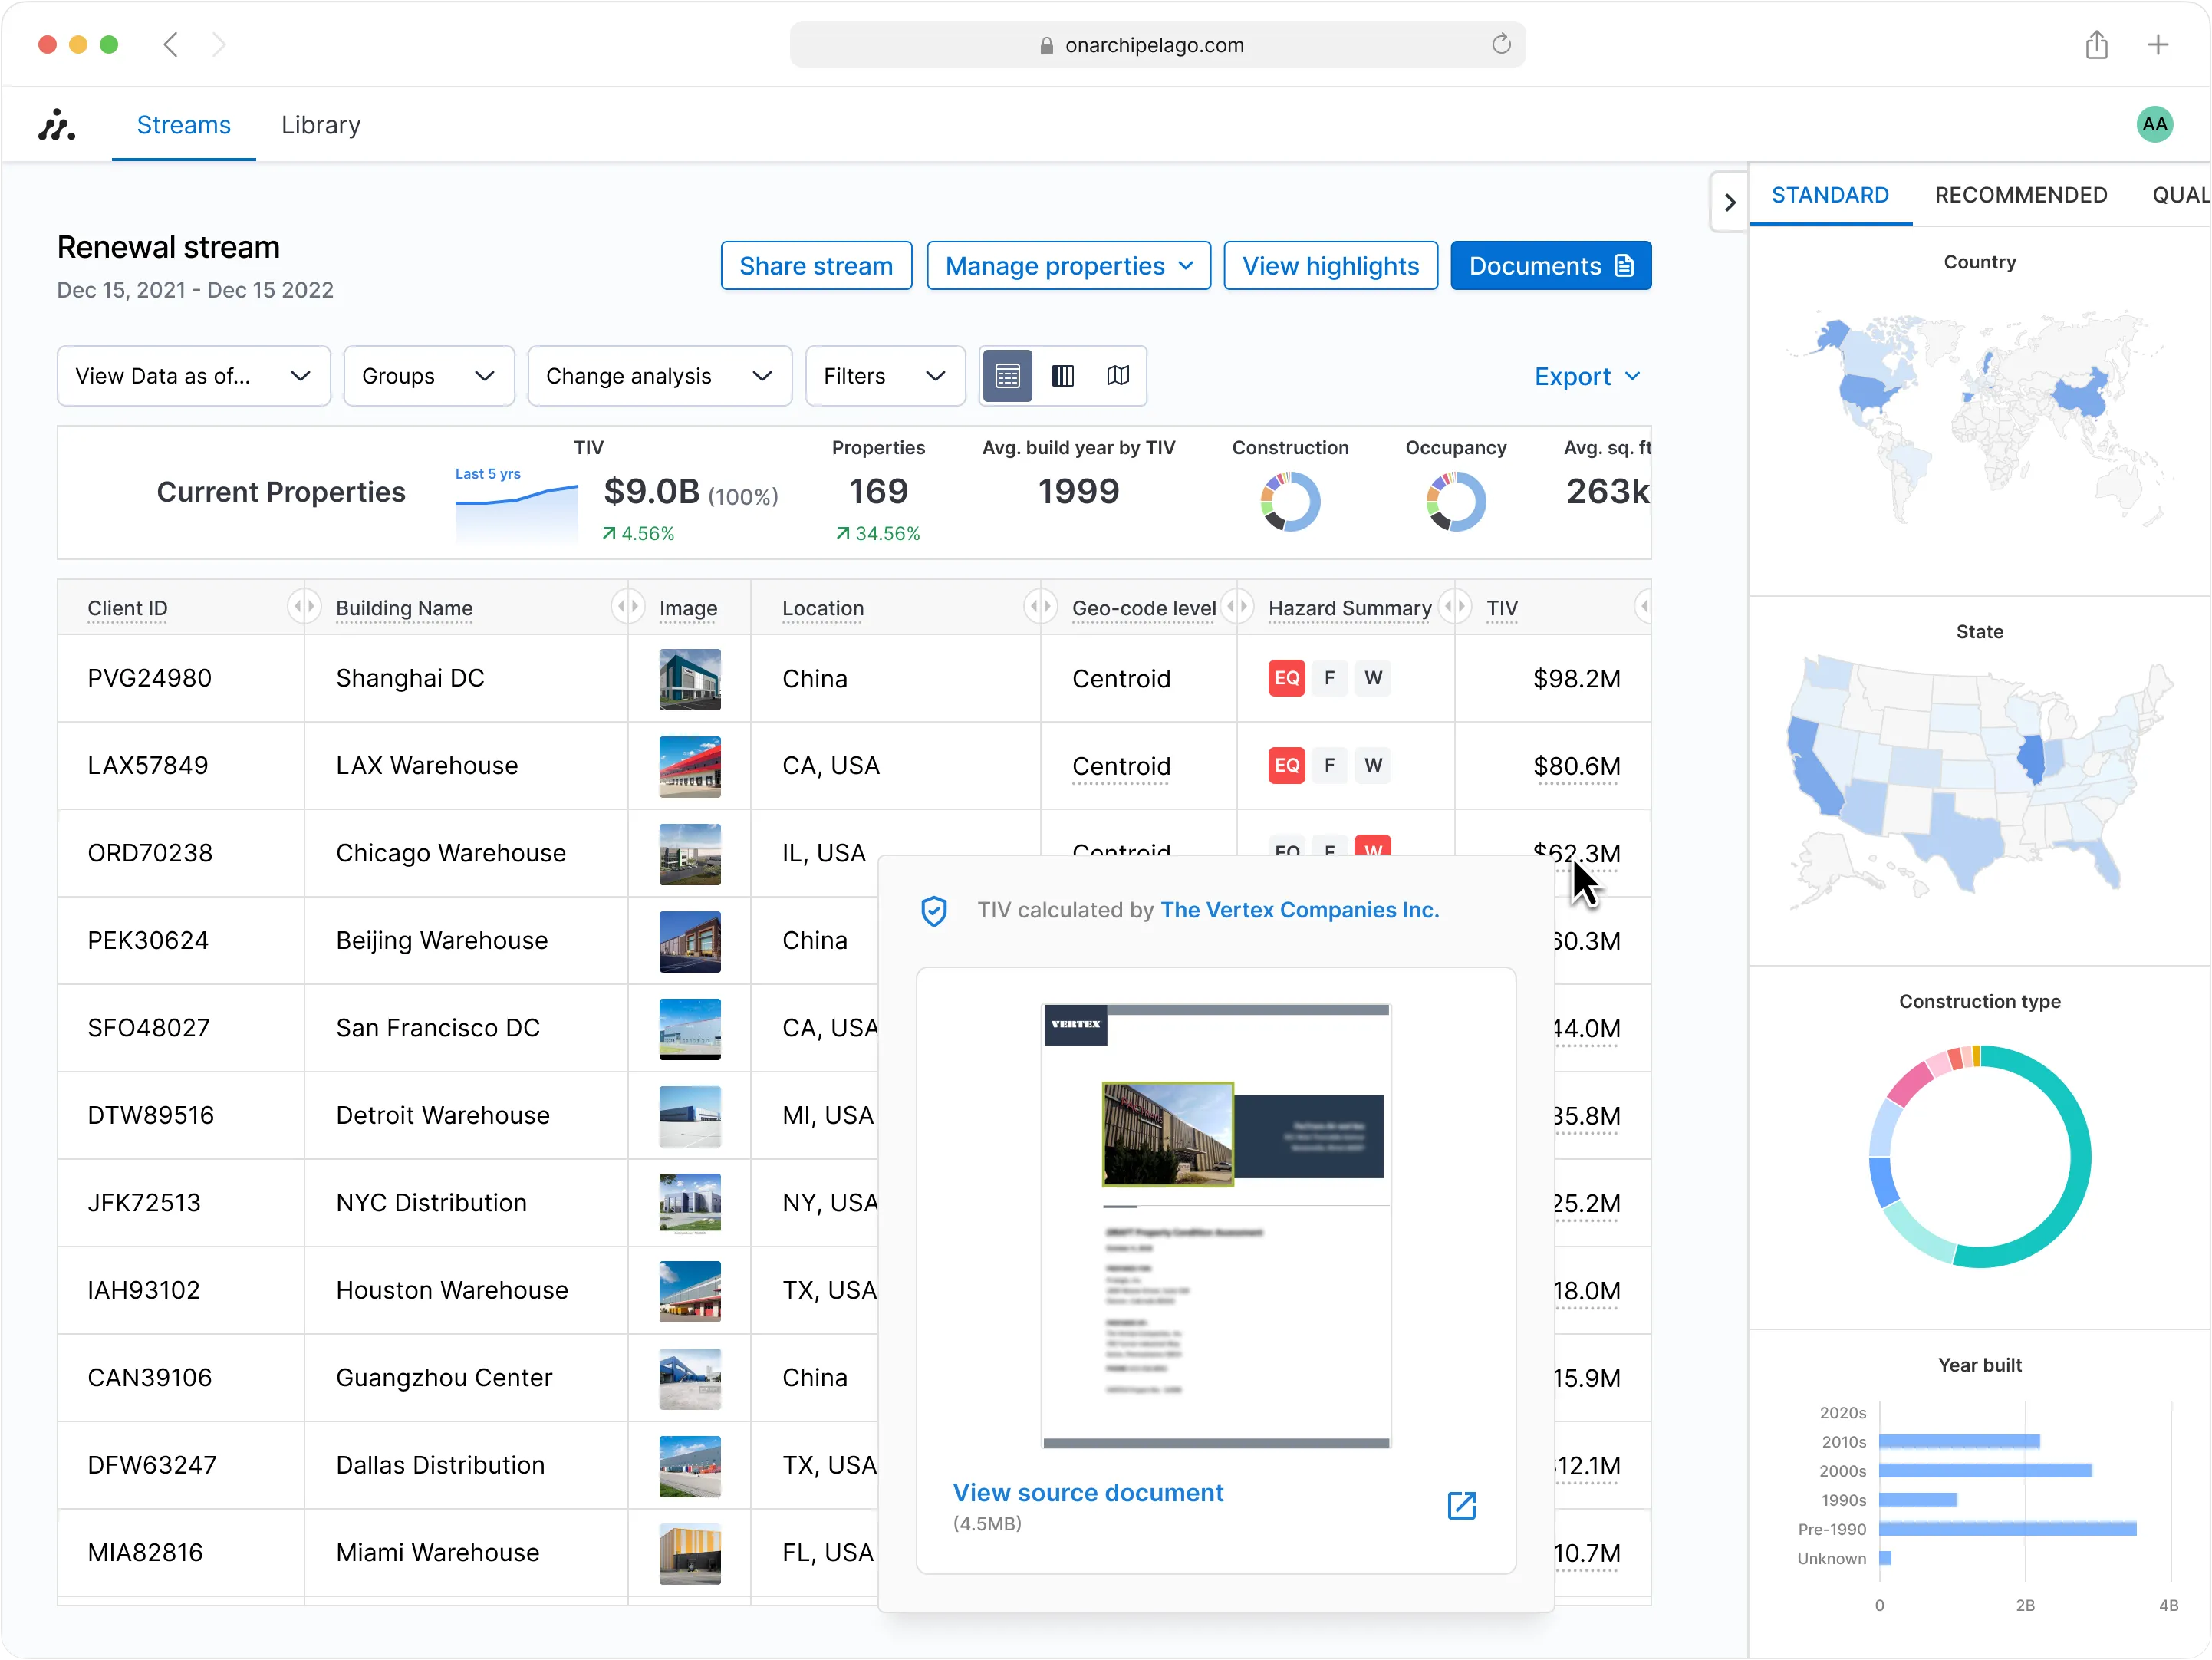
Trust through transparency: hovering reveals document sources, making data provenance immediately accessible without hiding complexity
Systematic Workflow Transformation: A new industry process creates better data for less stress: Risk managers maintain data year-round on Archipelago, with property managers having direct access to update their own records. When submission time arrives, brokers access the platform directly, and insurers receive data they can trust.
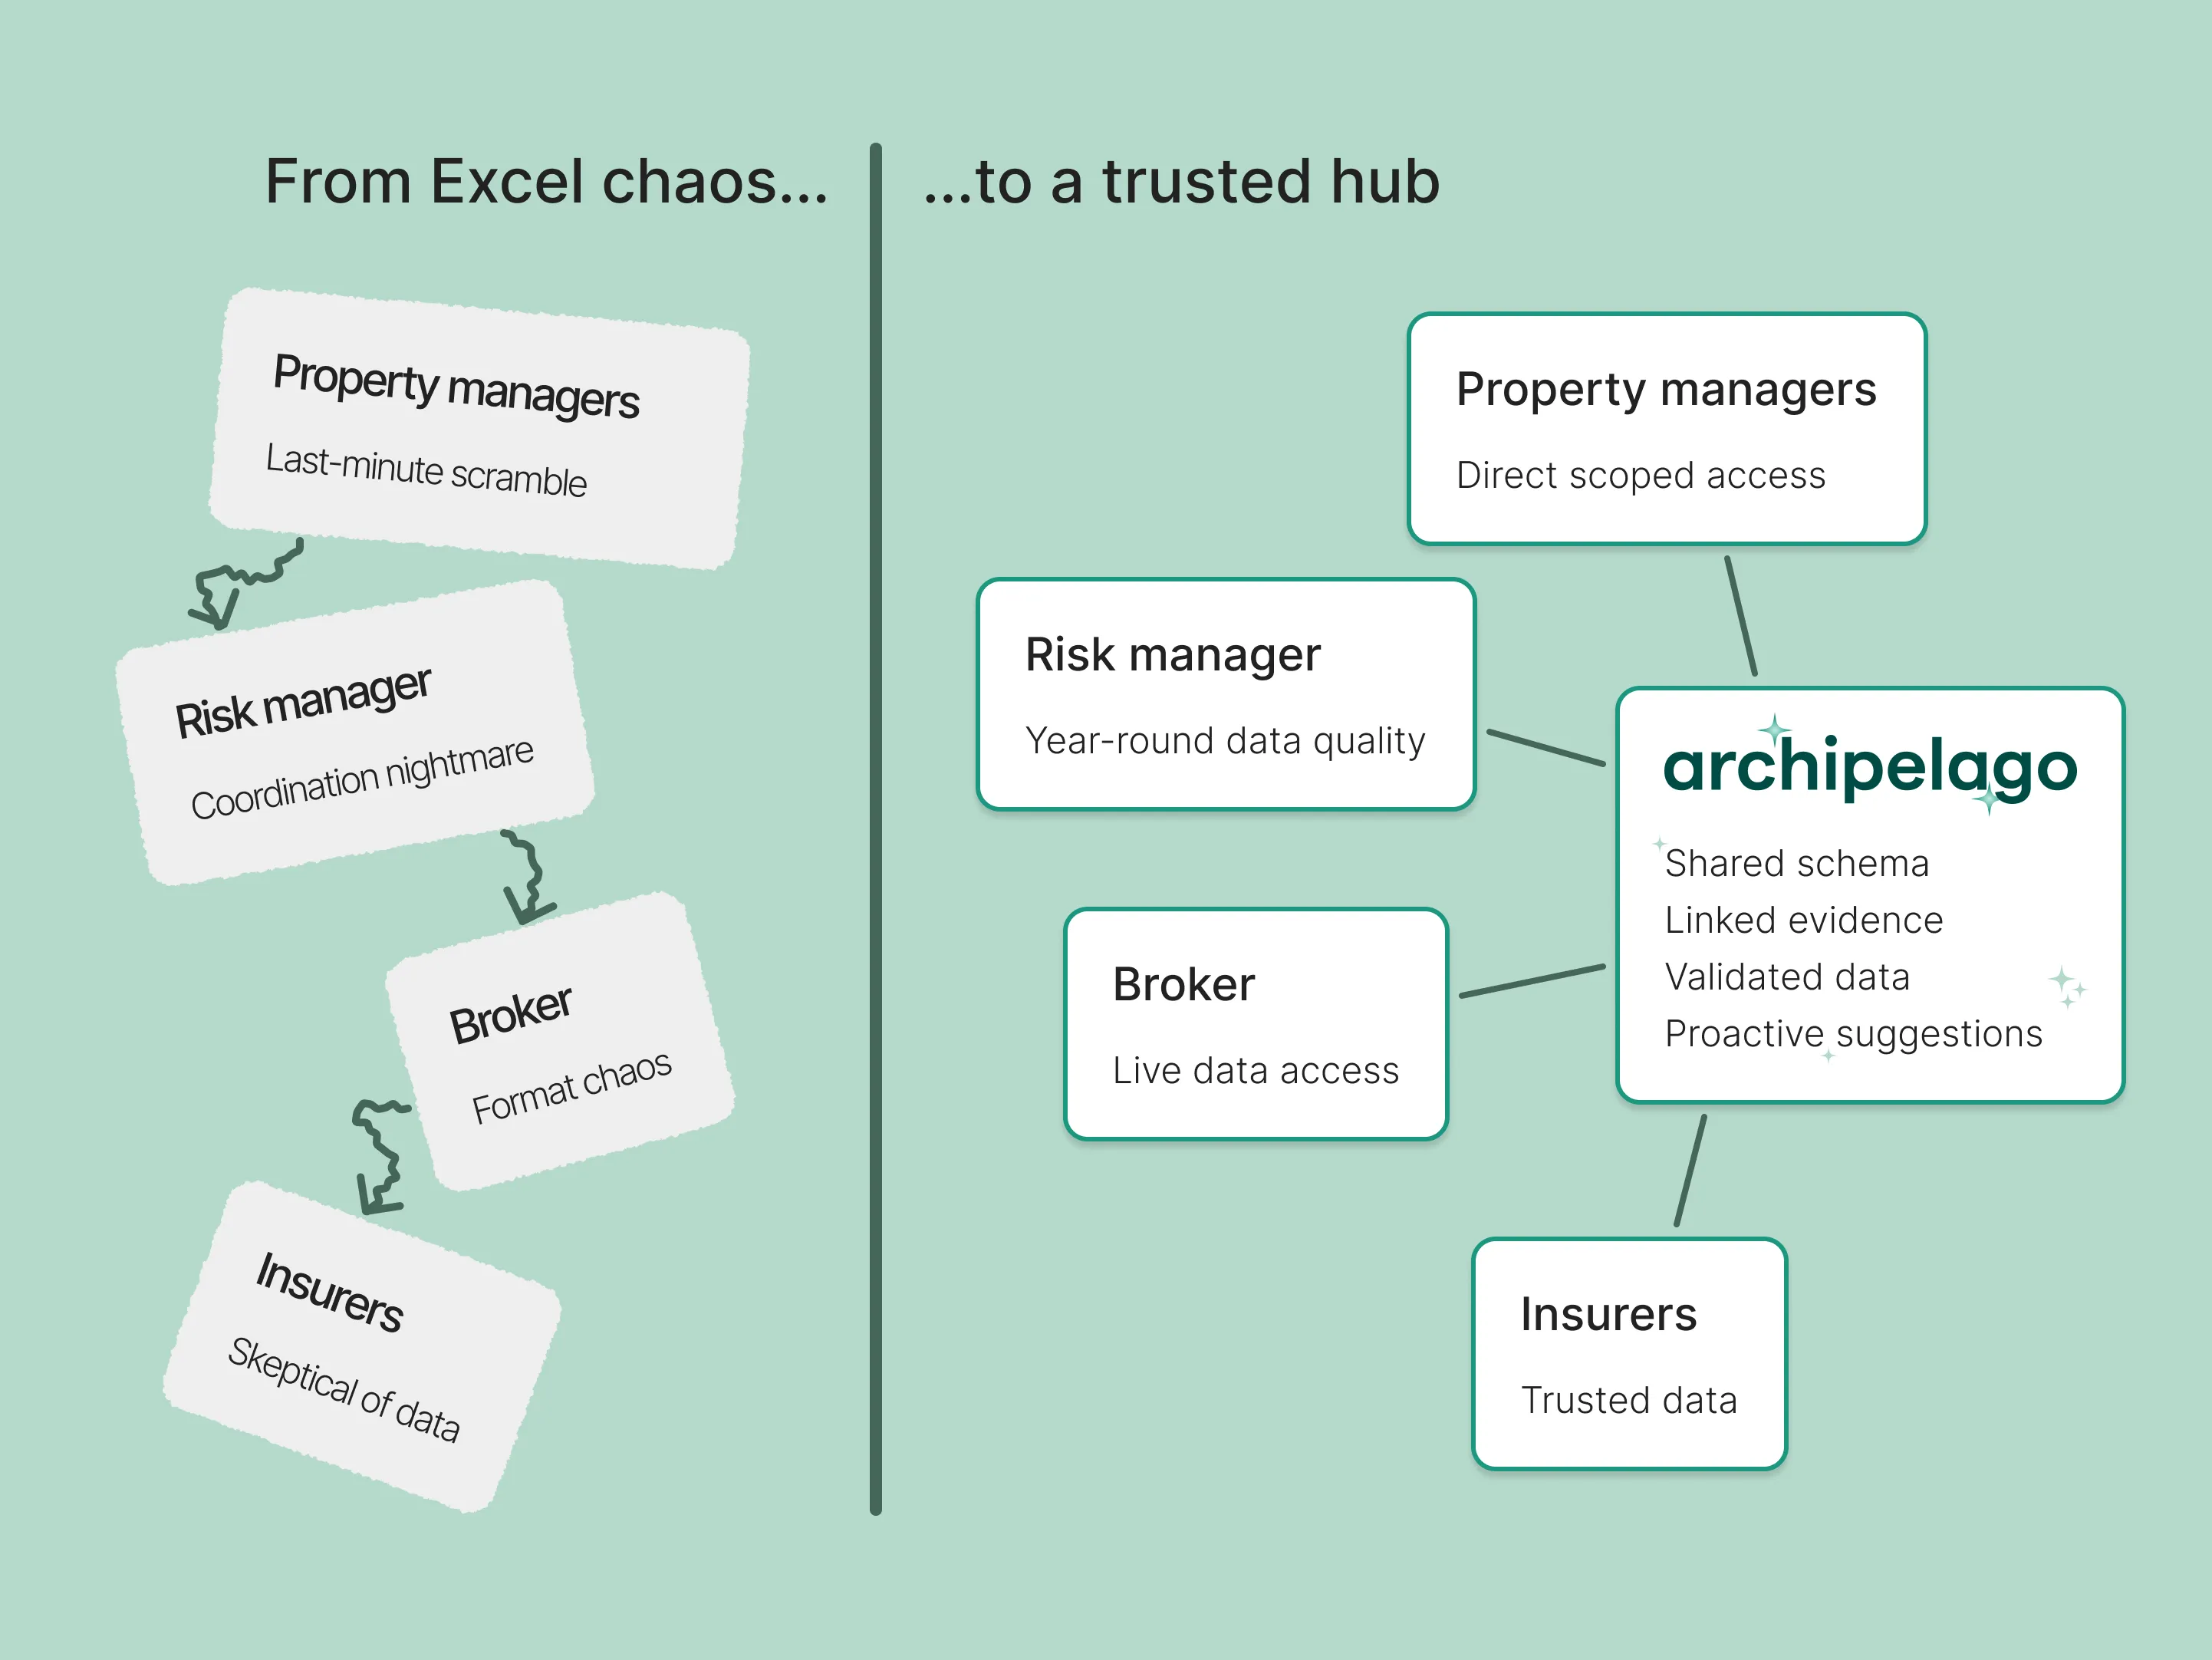
Industry transformation: from frantic year-end Excel pushes to year-round systematic data maintenance with direct stakeholder access
Key insights
Moving users from Excel to a web platform meant understanding not just what they needed, but how their existing mental models could be evolved. Two discoveries shaped how we bridged this transition:
Excel mental models run deep: Users frequently talked about ‘all the data’, but their actual workflows started with a set of Excel pivot tables to quickly assess submissions. This led to designing the ‘Explorers’, interactive widgets that provided instant visual breakdowns across multiple data dimensions, updating dynamically as users filter & explore the data.
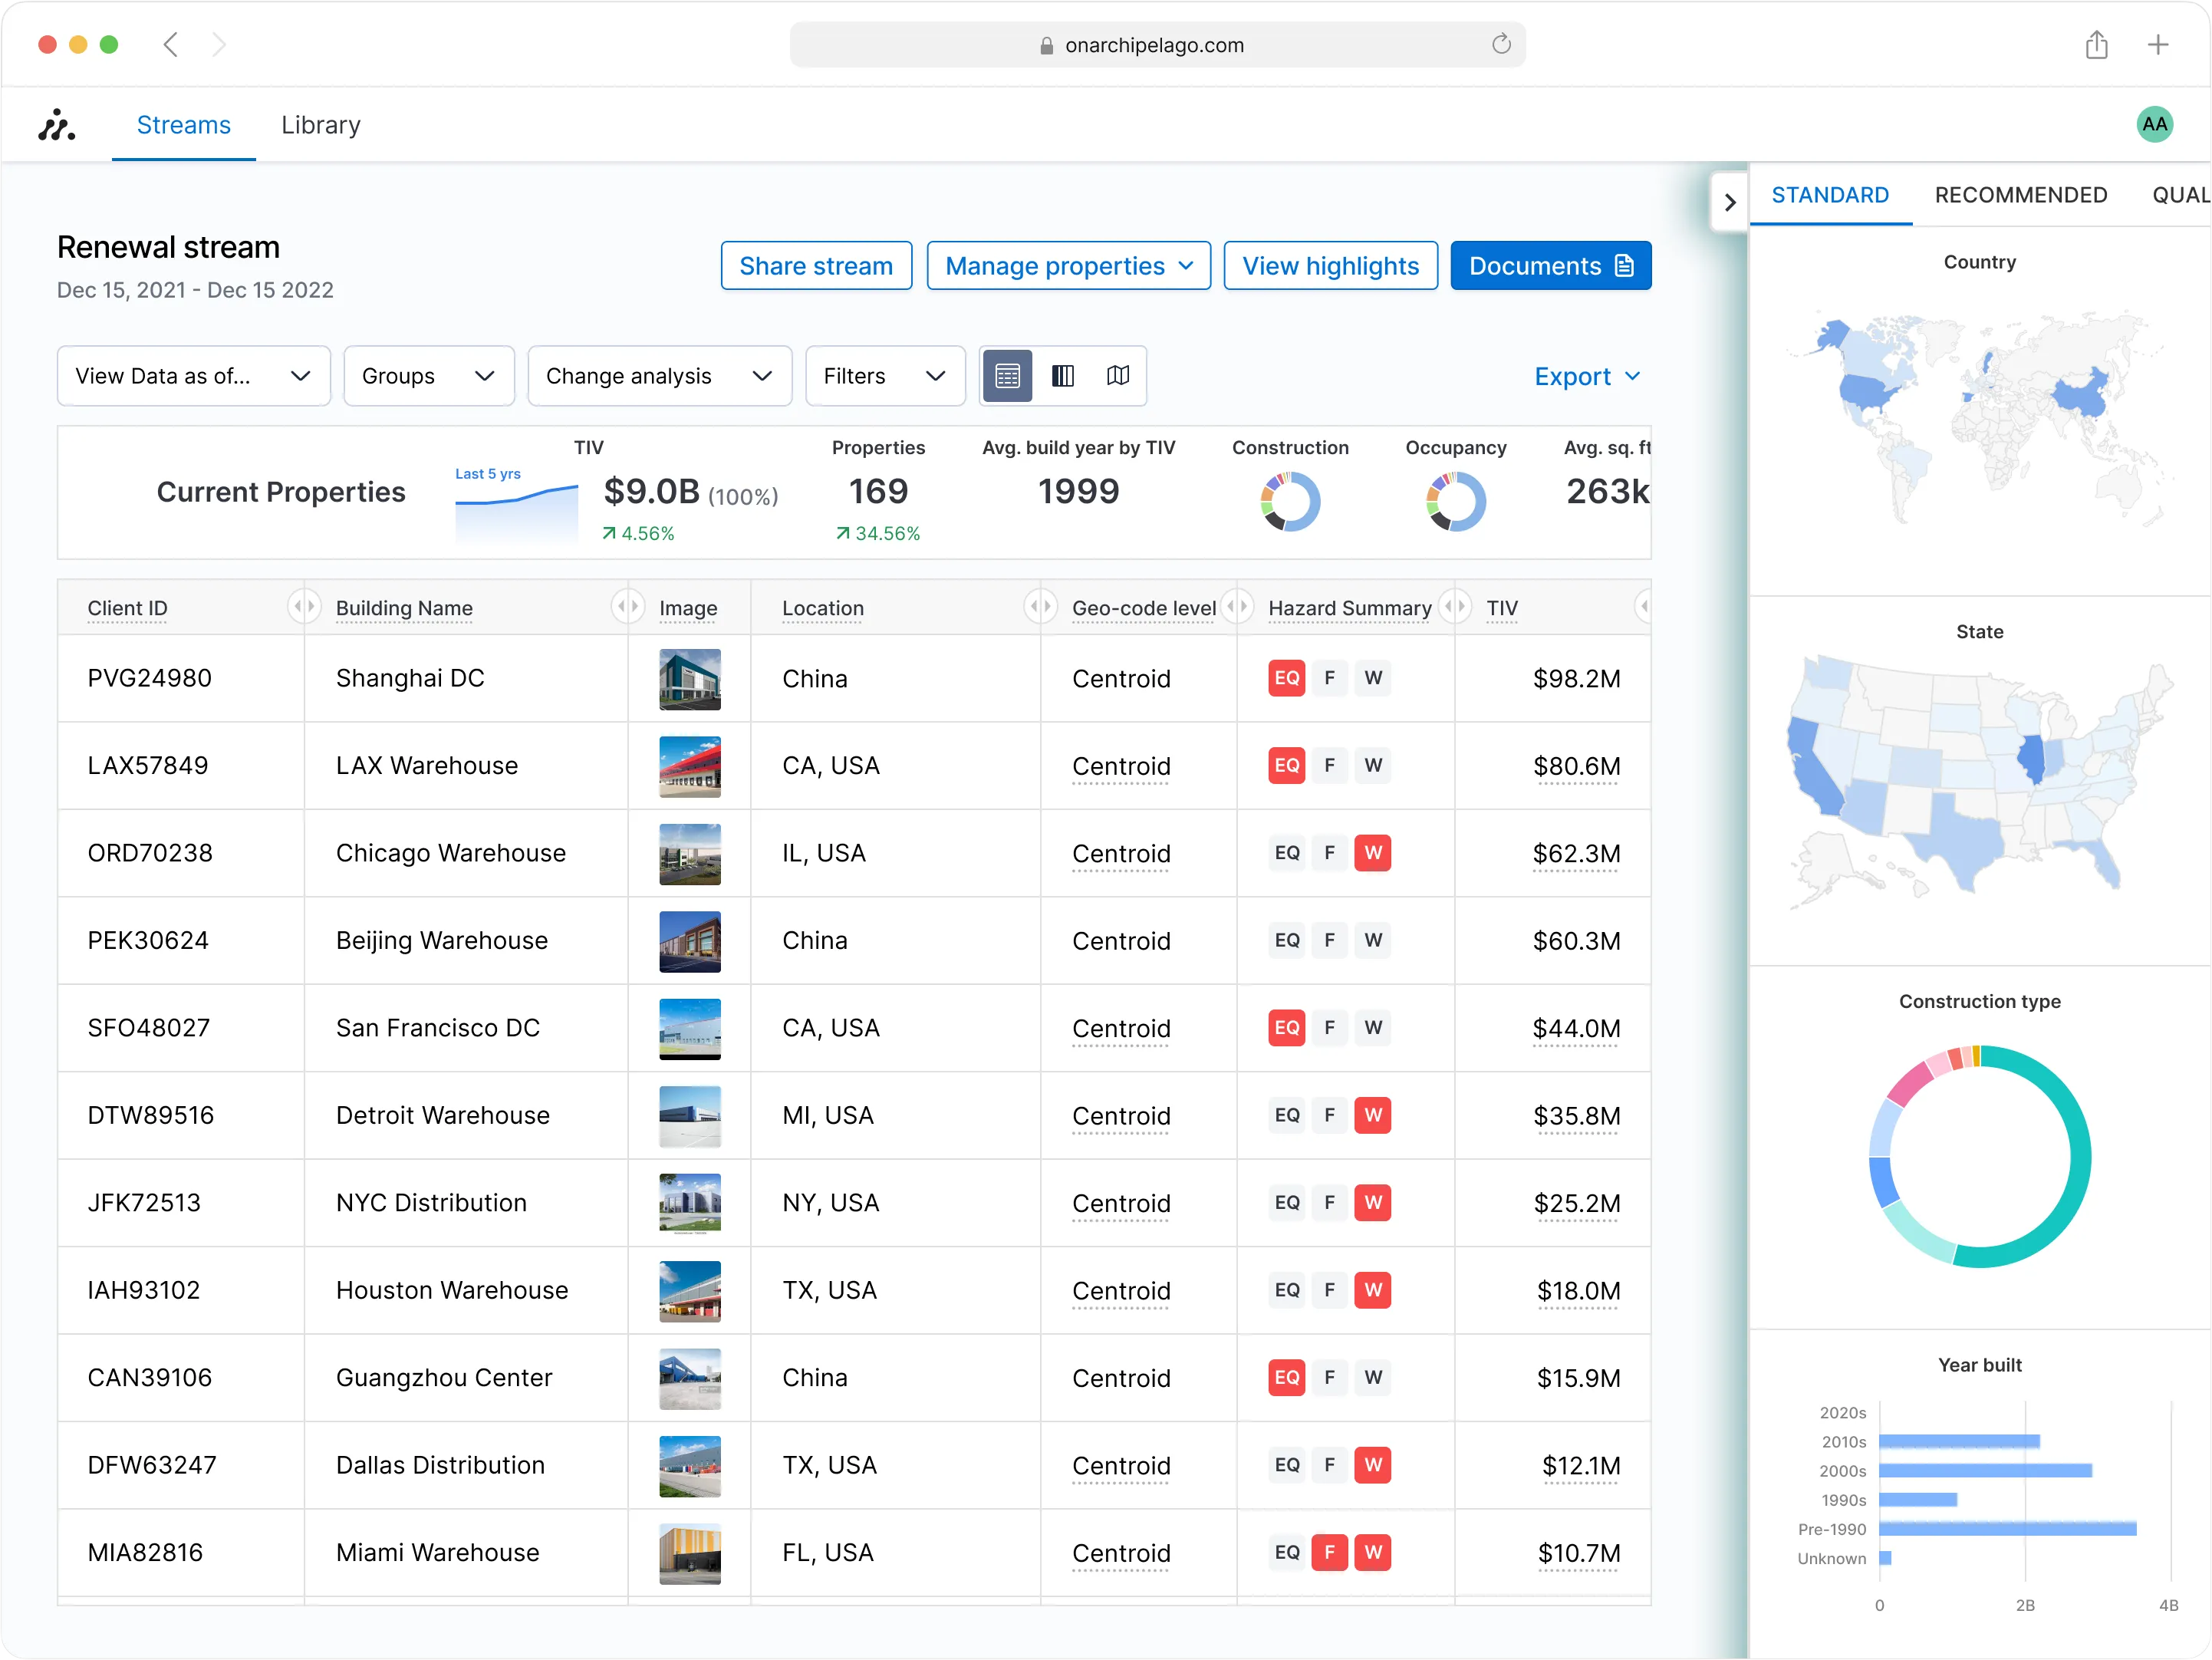
Explorers widgets: interactive data breakdowns that evolved users from Excel pivot table mental models to web-native analysis tools
Trust through presence, not inspection: Evidentiary documents were simultaneously absolutely critical and rarely viewed. New users would inspect a few initially, but once they understood the feature, they almost never opened documents again. The simple visual indicator, a dotted underline, was enough to generate the trust they needed.
Document preview on hover: the simple visual indicator generates trust through presence rather than requiring constant inspection
Impact
The platform didn’t aim to simply improve individual interfaces, it transformed an entire industry ecosystem. By designing a shared schema developed with input from structural experts, owners, brokers, and insurers, we eliminated the format inconsistencies that plagued the old Excel-based system. Risk managers now maintain data year-round rather than in frantic year-end pushes, brokers access live data directly, and insurers receive trusted submissions configured to match their specific processes. The shift from ‘assume the worst for missing data’ to ‘trust the transparent data’ represented a fundamental change in industry relationships.
Business outcomes: >90% of potential insurer customers were introduced to Archipelago through the platform, leading to 2 major insurer partnerships within a year of the launch. Customers across the industry praised the platform for making complex insurance data ‘understandable and trustable’, and owners loved earning points (and lower rates) from insurers for data transparency.
Reflection
This project reinforced for me that the most impactful design work often happens at the intersection of user experience and business operations. Early in Archipelago’s life, creating something visually impressive was crucial — the product demos closed sales. But as we grew, I learned to focus design efforts on the operational improvements that brought genuine business value.
While you’re here, check out some other projects: